NFL Stats and Trends
Updated : Sept. 9th, 2013.
How often does the Public win in the NFL?
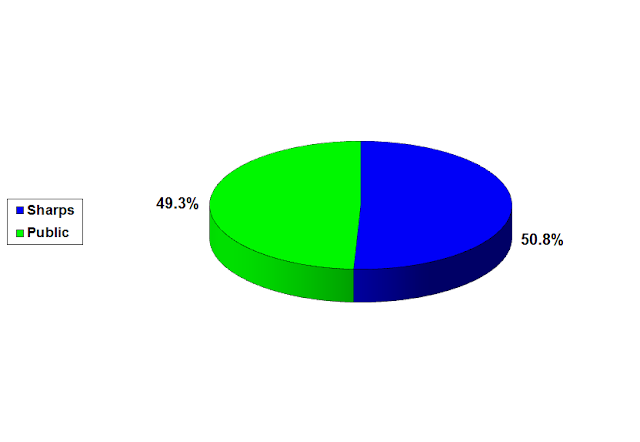
2012 NFL Regular Season ATS Public is 99-91 (52.1%)
2013 NFL Regular Season ATS Public is 3-7 (30%)
2012 NFL Playoffs ATS Public is 3-3 (50%)
2013 NFL Playoffs ATS Public is 4-3 (57.1%)
NFL Favorites vs Underdogs Against the Spread

2012 NFL Regular Season Favorites ATS 120-132-4 (47.6%)
2013 NFL Regular Season Favorites ATS 7-8-1 (46.6%)
2012 NFL Playoffs Favorites ATS 4-7 (36.4%)
2013 NFL Playoffs Favorites ATS 7-4 (63.6%)
How often do Favorites Win in the NFL Straight Up? (No Spread)

2012 NFL Regular Season SU 164-91-1 (64.3%)
2013 NFL Regular Season SU 12-4 (75%)
2012 NFL Playoffs SU 6-5 (54.5%)
2013 NFL Playoffs SU 8-3 (72.7%)
Public Underdogs on the Road

2012 NFL Regular Season ATS 14-8 (63.6%) SU 12-10 (54.5%)
2013 NFL Regular Season ATS 1-1-1 (50%) SU 1-2 (33.3%)
2012 NFL Playoffs ATS 1-0 (100%) SU 1-0 (100%)
2013 NFL Playoffs ATS 1-2 (33.3%) SU 1-2 (33.3%)
How often does the Spread Matter in the NFL?

2012 NFL Regular Season 43 out of 256 games (16.8%)
2013 NFL Regular Season 5 out of 16 games (31.3%)
2012 NFL Playoffs 2 out of 11 games (18.2%)
2013 NFL Playoffs 1 out of 11 games (9%)
How often do line moves Matter in the NFL?

2012 NFL Regular Season ATS 113-83 (57.6%)
2013 NFL Regular Season ATS 8-6 (57.1%)
2012 NFL Playoffs ATS 8-0 (100%)
2013 NFL Playoffs ATS 6-2 (75%)
Reverse Line Movement (RLM)

2012 NFL Regular Season ATS 44-33 (57.1%)
2013 NFL Regular Season ATS 3-0 (100%)
2012 NFL Playoffs ATS 2-0 (100%)
2013 NFL Playoffs ATS 1-1 (50%)
How often do favorites of 7 points or more win Straight Up?

2012 NFL Regular Season SU 60-10-1 (85.7%)
2013 NFL Regular Season SU 3-0 (100%)
2012 NFL Playoffs SU 4-2 (66.6%)
2013 NFL Playoffs SU 3-2 (60%)
How often do favorites of 6.5 points or less win Straight Up?

2012 NFL Regular Season SU 103-82 (55.7%)
2013 NFL Regular Season SU 9-4 (69.2%)
2012 NFL Playoffs SU 2-3 (40%)
2013 NFL Playoffs SU 5-1 (83.3%)
How often do favorites of 2.5 points or less win Straight Up?

2012 NFL Regular Season SU 26-29 (47.3%)
2013 NFL Regular Season SU 0-1 (0%)
2012 NFL Playoffs SU 0-1 (0%)
2013 NFL Playoffs SU 1-0 (100%)
Which side do NFL Spreads move to the most?

2012 NFL Regular Season 104-92-60 (40.8%) Underdog
2013 NFL Regular Season 4-10-2 (40%) Underdog
2012 NFL Playoffs 5-3-3 (45.4%) Underdog
2013 NFL Playoffs 3-5-3 (27.2%) Underdog

How bad are "bad" numbers in the NFL?
2012 NFL Regular Season 240-8-8 (93.8%)
2013 NFL Regular Season 15-0-1 (93.8%)
2012 NFL Playoffs 11-0-0 (100%)
2013 NFL Playoffs 9-1-1 (81.8%)
What is the average Point Spread in the NFL?
2011 NFL Regular Season -5.59
2012 NFL Regular Season -4.91
2013 NFL Regular Season -4.94
2012 NFL Playoffs -6.14
2013 NFL Playoffs -5.95
Graphs do NOT include Playoffs
All Lines are derived from Pinnacle Sports
ATS = Against The Spread
SU = Straight Up

